Fail:Damped spring.gif
Sellest suuremat pilti pole.
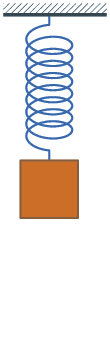
Damped_spring.gif (110 × 359 pikslit, faili suurus: 207 KB, MIME tüüp: image/gif, korduv, 65 kaadrit, 4,6 s)
| See fail ja sellest kastist allapoole jääv kirjeldus pärinevad kesksest failivaramust Wikimedia Commons. | Faili lehekülg Commonsis |
Lühikirjeldus
| Kirjeldus | Illustration of en:Damping |
| Kuupäev | (UTC) |
| Allikas | self-made with en:Matlab. Converted to gif animation with the en:ImageMagick convert tool (see the specific command later in the code). |
| Autor | Oleg Alexandrov |
| Teised versioonid |
 Harmonic version Harmonic version |
| GIF genesis | See GIF-rasterkujutis on valmistatud rakendusega MATLAB |
| Lähtekood | MATLAB code% Illustration of a damped spring
function main()
% colors
black = [0, 0, 0];
white = 0.99*[1, 1, 1];
cobalt = [0 71 171]/256;
pblue = [0 49 83]/256;
tene = [205 87 0]/256;
wall_color = pblue;
spring_color = cobalt;
mass_color = tene;
a=0.65; bmass_color = a*mass_color+(1-a)*black;
% linewidth and fontsize
lw=2;
fs=20;
ww = 0.5; % wall width
ms = 0.25; % the size of the mass
sw=0.1; % spring width
curls = 8;
A = 0.45; % the amplitude of spring oscillations
B = -1; % the y coordinate of the base state (the origin is higher, at the wall)
% Each of the small lines has length l
l = 0.05;
N = 15; % times per oscillation
No = 4; % number of oscillations
damping = 0.1; % controls the damping
for i = 1:(N*No+5)
% set up the plotting window
figure(1); clf; hold on; axis equal; axis off;
t = 2*pi*(i-1)/(N-0)+pi/2; % current time
H= A*exp(-damping*t)*sin(t) + B; % position of the mass
% plot the spring from Start to End
Start = [0, 0]; End = [0, H];
[X, Y]=do_plot_spring(Start, End, curls, sw);
plot(X, Y, 'linewidth', lw, 'color', spring_color);
% Here we cheat. We modify the point B so that the mass is attached exactly at the end of the
% spring. This should not be necessary. I am too lazy to to the exact calculation.
K = length(X); End(1) = X(K); End(2) = Y(K);
% plot the wall from which the spring is hanging
plot_wall(-ww/2, ww/2, l, lw, wall_color);
% plot the mass at the end of the spring
X=[-ms/2 ms/2 ms/2 -ms/2 -ms/2 ms/2]+End(1); Y=[0 0 -ms -ms 0 0]+End(2);
H=fill(X, Y, mass_color, 'EdgeColor', bmass_color, 'linewidth', lw);
% the bounding box
Sx = -0.4*ww; Sy = B-A*exp(-damping*3*pi/2)-ms+0.05;
Lx = 0.4*ww+l; Ly=l;
axis([Sx, Lx, Sy, Ly]);
plot(Sx, Sy, '*', 'color', white); % a hack to avoid a saveas to eps bug
saveas(gcf, sprintf('Spring_frame%d.eps', 1000+i), 'psc2') %save the current frame
disp(sprintf('Spring_frame%d', 1000+i)); %show the frame number we are at
pause(0.1);
end
% The following command was used to create the animated figure.
% convert -antialias -loop 10000 -delay 7 -compress LZW Spring_frame10* Damped_spring.gif
function [X, Y]=do_plot_spring(A, B, curls, sw);
% plot a 3D spring, then project it onto 2D. theta controls the angle of projection.
% The string starts at A and ends at B
% will rotate by theta when projecting from 1D to 2D
theta=pi/6;
Npoints = 500;
% spring length
D = sqrt((A(1)-B(1))^2+(A(2)-B(2))^2);
X=linspace(0, 1, Npoints);
XX = linspace(-pi/2, 2*pi*curls+pi/2, Npoints);
Y=-sw*cos(XX);
Z=sw*sin(XX);
% b gives the length of the small straight segments at the ends
% of the spring (to which the wall and the mass are attached)
b= 0.05;
% stretch the spring in X to make it of length D - 2*b
N = length(X);
X = (D-2*b)*(X-X(1))/(X(N)-X(1));
% shift by b to the right and add the two small segments of length b
X=[0, X+b X(N)+2*b]; Y=[Y(1) Y Y(N)]; Z=[Z(1) Z Z(N)];
% project the 3D spring to 2D
M=[cos(theta) sin(theta); -sin(theta) cos(theta)];
N=length(X);
for i=1:N;
V=M*[X(i), Z(i)]';
X(i)=V(1); Z(i)=V(2);
end
% shift the spring to start from 0
X = X-X(1);
% now that we have the horisontal spring (X, Y) of length D,
% rotate and translate it to go from A to B
Theta = atan2(B(2)-A(2), B(1)-A(1));
M=[cos(Theta) -sin(Theta); sin(Theta) cos(Theta)];
N=length(X);
for i=1:N;
V=M*[X(i), Y(i)]'+A';
X(i)=V(1); Y(i)=V(2);
end
function plot_wall(S, E, l, lw, wall_color)
% Plot a wall from S to E.
no=20; spacing=(E-S)/(no-1);
plot([S, E], [0, 0], 'linewidth', 1.8*lw, 'color', wall_color);
V=l*(0:0.1:1);
for i=0:(no-1)
plot(S+ i*spacing + V, V, 'color', wall_color)
end
|
Litsents
| Selle teose autoriõiguste valdajana annan selle teose avalikku omandisse. See kehtib üleilmselt. Kui see pole mõnes riigis õiguslikult võimalik: Annan kõigile õiguse seda teost kasutada ükskõik mille jaoks, ilma ühegi tingimuseta, kui seadus neid just ei sea. |
Faili ajalugu
Klõpsa kuupäeva ja kellaaega, et näha sel ajahetkel kasutusel olnud failiversiooni.
| Kuupäev/kellaaeg | Pisipilt | Mõõtmed | Kasutaja | Kommentaar | |
|---|---|---|---|---|---|
| viimane | 11. oktoober 2008, kell 20:11 | 110 × 359 (207 KB) | Nard the Bard | replace lost file | |
| 24. juuni 2007, kell 06:54 | Pisipilti ei ole | 110 × 359 (207 KB) | Oleg Alexandrov | Illustration of en:Damping {{Information |Description= |Source=self-made with en:Matlab. Converted to gif animation with the en:ImageMagick convert tool (see the specific command later in the code). |Date= 02:42, 24 June 2007 (UTC) |Autho |
Faili kasutus
Seda faili kasutavad järgmised 2 lehekülge:
Globaalne failikasutus
Järgmised muud vikid kasutavad seda faili:
- Faili kasutus vikis ar.wikipedia.org
- Faili kasutus vikis arz.wikipedia.org
- Faili kasutus vikis ca.wikipedia.org
- Faili kasutus vikis cs.wikipedia.org
- Faili kasutus vikis cv.wikipedia.org
- Faili kasutus vikis cy.wikipedia.org
- Faili kasutus vikis da.wikipedia.org
- Faili kasutus vikis de.wikipedia.org
- Faili kasutus vikis en.wikipedia.org
- Faili kasutus vikis en.wikibooks.org
- Faili kasutus vikis fa.wikipedia.org
- Faili kasutus vikis fi.wikipedia.org
- Faili kasutus vikis fi.wiktionary.org
- Faili kasutus vikis fr.wikipedia.org
- Faili kasutus vikis fr.wikibooks.org
- Faili kasutus vikis ga.wikipedia.org
- Faili kasutus vikis he.wikipedia.org
- Faili kasutus vikis hi.wikipedia.org
- Faili kasutus vikis hy.wikipedia.org
- Faili kasutus vikis it.wikipedia.org
- Faili kasutus vikis ja.wikipedia.org
- Faili kasutus vikis ko.wikipedia.org
- Faili kasutus vikis lv.wikipedia.org
- Faili kasutus vikis mk.wikipedia.org
- Faili kasutus vikis myv.wikipedia.org
- Faili kasutus vikis nl.wikipedia.org
- Faili kasutus vikis ru.wikipedia.org
- Faili kasutus vikis simple.wikipedia.org
- Faili kasutus vikis sk.wikipedia.org
- Faili kasutus vikis sv.wikipedia.org
- Faili kasutus vikis uk.wikipedia.org
- Faili kasutus vikis uz.wikipedia.org
- Faili kasutus vikis www.wikidata.org
- Faili kasutus vikis zh.wikipedia.org