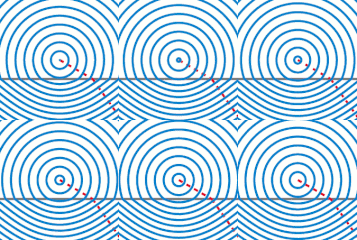
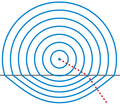
Fail:Snells law wavefronts.gif

Snells_law_wavefronts.gif(225 × 227 pikslit, faili suurus: 65 KB, MIME tüüp: image/gif, korduv, 10 kaadrit, 0,1 s)

Titel

Lühikirjeldus

 
See GIF-rasterkujutis on valmistatud rakendusega MATLAB.
Kirjeldus
English: Illustration of wavefronts in the context of Snell's law.
Kuupäev (UTC)
Allikas Own work, created with MATLAB. (Source code below.)
Autor Oleg Alexandrov
Luba
(Faili edasikasutus)
Public domain Selle teose autoriõiguste valdajana annan selle teose avalikku omandisse. See kehtib üleilmselt.
Kui see pole mõnes riigis õiguslikult võimalik:
Annan kõigile õiguse seda teost kasutada ükskõik mille jaoks, ilma ühegi tingimuseta, kui seadus neid just ei sea.
Teised versioonid
Vektorkujutis (SVG) sellest pildist on saadaval. Kui SVG-pilt paremat kvaliteeti võimaldab, tuleks seda rasterkujutise asemel kasutada.

File:Snells law wavefronts.gif → File:Snells law wavefronts.svg

Vektorgraafika kohta loe lisaks Commonsi abilehelt, metaviki abilehelt ja Vikipeediast.

Teistes keeltes
Alemannisch  Bahasa Indonesia  Bahasa Melayu  British English  català  čeština  dansk  Deutsch  eesti  English  español  Esperanto  euskara  français  Frysk  galego  hrvatski  Ido  italiano  lietuvių  magyar  Nederlands  norsk bokmål  norsk nynorsk  occitan  Plattdüütsch  polski  português  português do Brasil  română  Scots  sicilianu  slovenčina  slovenščina  suomi  svenska  Tiếng Việt  Türkçe  vèneto  Ελληνικά  беларуская (тарашкевіца)  български  македонски  нохчийн  русский  српски / srpski  татарча/tatarça  українська  ქართული  հայերեն  বাংলা  தமிழ்  മലയാളം  ไทย  한국어  日本語  简体中文  繁體中文  עברית  العربية  فارسی  +/−
Uus vektorkujutis

Source code

% Illustration of Snell's law
function main()

   % indexes of refraction
   n1=1.0;
   n2=1.5;

   sign = -1;% is the source up or down?
   O=[0, -1*sign];
   k=500;

   
% KSmrq's colors
   red    = [0.867 0.06 0.14];
   blue   = [0, 129, 205]/256;
   green  = [0, 200,  70]/256;
   yellow = [254, 194,   0]/256;
   white = 0.99*[1, 1, 1];
   black = [0, 0, 0];
   gray = 0.5*white;

   color1=red;
   color2=blue;
   color3=gray;
   lw = 3;
   
   plot_line=0;
   Theta=linspace(0, 2*pi, k);
   V=0*Theta; W=0*Theta;
   S0=7;
   spacing=0.45;
   p=floor(S0/spacing);
   S=linspace(0, S0, p+1);
   spacing=S(2)-S(1);
   
   num_frames = 10;
   for frame_iter=1:num_frames

      figure(1); clf; hold on; axis equal; axis off;

      % plot the interface between diellectrics
      L=1.2*S0;
      plot([-L, L], [0, 0], 'color', color3, 'linewidth', lw);
      
      
      % plot a ray
      plot_line=1;
      s=L;
      theta=pi/3; wfr(s, theta, n1, n2, O, sign, plot_line, color1, lw);

      % plot the wafefronts
      plot_line=0;
      for i=1:p

	 s=S(i)+spacing*(frame_iter-1)/num_frames;

	 for j=1:k
	    theta=Theta(j);
	    [V(j), W(j)]=wfr(s, theta, n1, n2, O, sign, plot_line, color1, lw);
	 end
	 plot(V, W, 'color', color2, 'linewidth', lw);
      end
      

      %  dummy points to enlarge the bounding box
      plot(0, S0+2.5*spacing, '*', 'color', white);
      plot(0, -(S0+2.5*spacing)/n2, '*', 'color', white);

      % to know where to crop later
      Lx=3.2; Ly=Lx; shift = 1;
      plot([-Lx, Lx, Lx, -Lx -Lx], ...
           [-Ly, -Ly, Ly, Ly, -Ly]+shift);

      file = sprintf('Frame%d.eps', 1000+frame_iter);
      disp(file);
      saveas(gcf, file, 'psc2')
   end
end

% Converted to gif with the UNIX command
% convert -density 100 -antialias Frame10* Snell_animation.gif 
% then cropped in Gimp

function [a, b]=wfr(s, theta, n1, n2, O, sign, plot_line, color1, lw);

   X=O+s*[sin(theta), sign*cos(theta)];

  if( sign*X(2) > 0 )
    t=-sign*O(2)/cos(theta);
    X0=O+t*[sin(theta), sign*cos(theta)];
    
    if (plot_line == 1) 
      plot([O(1), X0(1)], [O(2), X0(2)], 'color', color1, 'linewidth', lw, 'linestyle', '--');
    end

    d = norm(O-X0);
    r = (s-d)*(n2/n1)^(sign);

    theta2=asin(n1*sin(theta)/n2);
    XE=X0+r*[sin(theta2), sign*cos(theta2)];
  else
    XE = X;
  end  
  a = XE(1);
  b = XE(2); 

  if (plot_line==1)
    plot([X0(1), XE(1)], [X0(2), XE(2)], 'color', color1, 'linewidth', lw, 'linestyle', '--');
  end  
end

Pealdised

Lisa üherealine seletus sellest, mida fail esitab
Wavefronts from a point source of light.In a particuler wavefront u will see that the dist btw source & wavefront above the line is > dist btw source & wavefront below the line beacuse lightspeed is greater in the above and lower in below.

Selles failis kujutatud üksused

kujutab

Faili ajalugu

Klõpsa kuupäeva ja kellaaega, et näha sel ajahetkel kasutusel olnud failiversiooni.

Kuupäev/kellaaegPisipiltMõõtmedKasutajaKommentaar
viimane5. juuli 2009, kell 12:59Pisipilt versioonist seisuga 5. juuli 2009, kell 12:59225 × 227 (65 KB)Capmoreduced to 16 colors with no quality loss
2. jaanuar 2008, kell 09:31Pisipilt versioonist seisuga 2. jaanuar 2008, kell 09:31225 × 227 (148 KB)Oleg Alexandrov{{Information |Description=Illustration of wavefronts in the context of Snell's law. |Source=self-made with MATLAB |Date=05:36, 1 January 2008 (UTC) |Author= Oleg Alexandrov |Permission= |oth

Seda faili kasutab järgmine lehekülg:

Globaalne failikasutus

Järgmised muud vikid kasutavad seda faili:

Vaata selle faili globaalset kasutust.