Fail:Butterworth response.svg

Selle SVG-faili PNG-vormingus eelvaate suurus: 512 × 384 pikslit. Teised eraldusvõimed: 320 × 240 pikslit | 640 × 480 pikslit | 1024 × 768 pikslit | 1280 × 960 pikslit | 2560 × 1920 pikslit.
Algfail (SVG-fail, algsuurus 512 × 384 pikslit, faili suurus: 41 KB)
| See fail ja sellest kastist allapoole jääv kirjeldus pärinevad kesksest failivaramust Wikimedia Commons. | Faili lehekülg Commonsis |
Lühikirjeldus
| Kirjeldus |
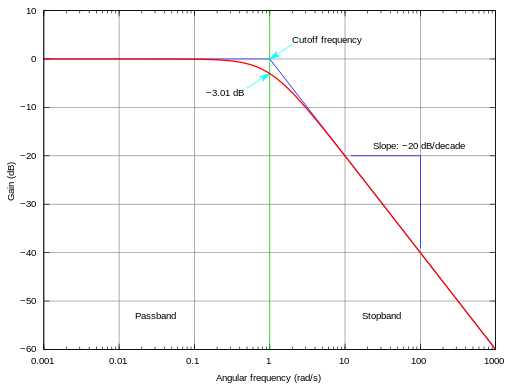
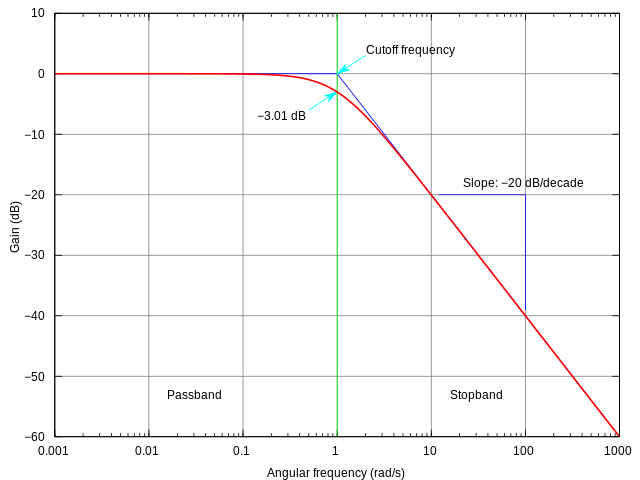
English: This is the SVG version of the PNG image created by Omegatron.
I simply changed the terminal type from PostScript to SVG in the gnuplot script file. The frequency response of a Butterworth filter with logarithmic axes (Bode plot) and various labels. Cutoff frequency is normalized to 1 rad/s. Gain is normalized to 0 dB in the passband.
|
||||
| Kuupäev | (UTC) | ||||
| Allikas | |||||
| Autor |
|
||||
| Teised versioonid |
|
||||
| gnuplot source | click to expand
set samples 2001
# set terminal postscript enhanced landscape color lw 2 "Times-Roman" 20
set terminal svg size 800 600 dynamic enhanced
set output "butterworth.svg"

# Butterworth amplitude response and decibel calculation.  n is the order, which is just 1 in this image.
G(w,n) = 1 / (sqrt(1 + w**(2*n)))
dB(x) = 20 * log10(abs(x))

# Gridlines
set grid

# Set x axis to logarithmic scale
set logscale x 10

# Set range of x and y axes
set xrange [0.001:1000]
set yrange [-60:10]

# Create x-axis tic marks once per decade (every multiple of 10)
set xtics 10

# Use 10 x-axis minor divisions per major division
set mxtics 10

# Axis labels
set xlabel "Angular frequency (rad/s)"
set ylabel "Gain (dB)"

# No need for a key
set nokey #0.1,-25

# Frequency response's line plotting style
set style line 1 lt 1 lw 2

# Draw a separator between passband and stopband and label them
set style line 2 lt 2 lw 1
set style arrow 2 nohead ls 2
set arrow 3 from 1,-60 to 1,10 as 2

# Label coordinates are relative to the graph window, not to the function, centered at the 1/4 and 3/4 width points
set label 1 "Passband" at graph 0.25, graph 0.1 c
set label 2 "Stopband" at graph 0.75, graph 0.1 c

# Asymptote lines and slope lines are the same "arrow" style
set style line 3 lt 3 lw 1
set style arrow 3 nohead ls 3

# Draw asymptote lines
set arrow 1 from 1,0 to 1000,-60 as 3
set arrow 2 from .001,0 to 1,0 as 3

# -3 dB arrow style and arrow
set style line 4 lt 4 lw 1
set style arrow 4 head filled size screen 0.02,15,45 ls 4
set arrow 4 from 2,3 to 1,0 as 4

# "Cutoff frequency" label uses same coordinates as the function
set label 3 "Cutoff frequency" at 2,4 l

# "-3 dB" label
set arrow 5 from 0.5,-6 to 1,-3 as 4
set label 4 "-3.01 dB" at 0.5,-7 r

# Draw slope lines and label
set arrow 6 from 100,-20 to 12,-20 as 3
set arrow 7 from 100,-20 to 100,-39 as 3
set label 5 "Slope: -20 dB/decade" at 100,-18 c

# Plot the filter response
plot
     dB(G(x,1)) ls 1  title "1st-order response"

unset output      # cleanup the handle
|


Litsents
Autoriõiguse omanikuna avaldan selle teose järgmiste litsentside all:
See fail kuulub Creative Commonsi jurisdiktsiooniga sidumata litsentsi "Autorile viitamine + jagamine samadel tingimustel 3.0" ning üldise litsentsi "Autorile viitamine + jagamine samadel tingimustel" versioonide 2.5, 2.0 ja 1.0 alla.
- Tohid:
- jagada – teost kopeerida, levitada ja edastada
- kohandada – valmistada muudetud teoseid
- Järgmistel tingimustel:
- omistamine – Pead materjali sobival viisil autorile omistama, tooma ära litsentsi lingi ja märkima ära, kas on tehtud muudatusi. Sobib, kui teed seda mõistlikul viisil, kuid seejuures ei tohi jääda muljet, et litsentsiandja tõstab esile sind või seda, et sina materjali kasutad.
- sarnaselt jagamine – Kui töötled, kujundad ümber või arendad materjali edasi, siis pead oma töö levitamiseks kasutama sama litsentsi, mille all on algupärand, või ühilduvat litsentsi.

|
Luba on antud selle dokumendi kopeerimiseks, avaldamiseks ja/või muutmiseks GNU Vaba Dokumentatsiooni Litsentsi versiooni 1.2 või hilisema Vaba Tarkvara Fondi avaldatud versiooni tingimuste alusel; muutumatute osadeta, esikaane tekstideta ja tagakaane tekstideta. Sellest loast on lisatud koopia leheküljel pealkirjaga "GNU Free Documentation License". |
Sa võid valida endale sobiva litsentsi.
Esialgne üleslaadimislogi
This image is a derivative work of the following images:
- Image:Butterworth_response.png licensed with Cc-by-sa-3.0,2.5,2.0,1.0, GFDL
- 2005-07-23T17:45:55Z Omegatron 1240x880 (87607 Bytes) split the cutoff frequency markers
- 2005-07-23T16:31:54Z Omegatron 1250x880 (94570 Bytes) Better butterworth filter response curve
- 2005-06-26T19:54:33Z Omegatron 250x220 (2251 Bytes) A graph or diagram made by [[User:Omegatron]]. (Uploaded with Wikimedia Commons.) Source: Created by [[User:Omegatron]] {{GFDL}}{{cc-by-sa-2.0}} [[Category:Diagrams]]\
Uploaded with derivativeFX
Faili ajalugu
Klõpsa kuupäeva ja kellaaega, et näha sel ajahetkel kasutusel olnud failiversiooni.
| Kuupäev/kellaaeg | Pisipilt | Mõõtmed | Kasutaja | Kommentaar | |
|---|---|---|---|---|---|
| viimane | 25. aprill 2013, kell 12:50 | | 512 × 384 (41 KB) | Incnis Mrsi | dehyphenation |
| 5. juuli 2008, kell 02:17 |  | 512 × 384 (41 KB) | Krishnavedala | {{Information |Description=This is the en:SVG version of the en:PNG image created by en:User:Omegatron. I simply changed the terminal type from en:postscript to SVG in the en:GNUplot script file. The [[w:frequency response|frequency |
Faili kasutus
Seda faili kasutavad järgmised 2 lehekülge:
Globaalne failikasutus
Järgmised muud vikid kasutavad seda faili:
- Faili kasutus vikis ca.wikipedia.org
- Faili kasutus vikis cv.wikipedia.org
- Faili kasutus vikis de.wikipedia.org
- Faili kasutus vikis en.wikipedia.org
- Faili kasutus vikis en.wikibooks.org
- Faili kasutus vikis eo.wikipedia.org
- Faili kasutus vikis es.wikipedia.org
- Faili kasutus vikis fa.wikipedia.org
- Faili kasutus vikis fi.wikipedia.org
- Faili kasutus vikis ko.wikipedia.org
- Faili kasutus vikis pt.wikipedia.org
- Faili kasutus vikis simple.wikipedia.org
- Faili kasutus vikis su.wikipedia.org
- Faili kasutus vikis uk.wikipedia.org
- Faili kasutus vikis vi.wikipedia.org
- Faili kasutus vikis zh.wikipedia.org